Reports
A state, not an execution log
This is the distinction that structures everything else:
A daily report is a state of the fleet, not an account of the day's executions.
Not every device is scheduled every day. A device backed up on Monday and looked at on Thursday is healthy: the report shows that its last backup went well and that it is three days old. It does not flag it as missing.
Each device's state is therefore computed from three elements, never from the last run's status alone:
- the date of the last successful backup;
- the status of the last run, successful or not;
- the expected cadence, deduced from the schedule.
See Staleness tolerance for the detail of the computation.
Exception view
A report's default view is the exception. Out of two thousand devices, eight of them in trouble, the report presents the eight.
A report of two thousand correct lines is not read, and the eight that matter get
lost in it. The complete inventory stays available on explicit request, in the
same structure: view=all.
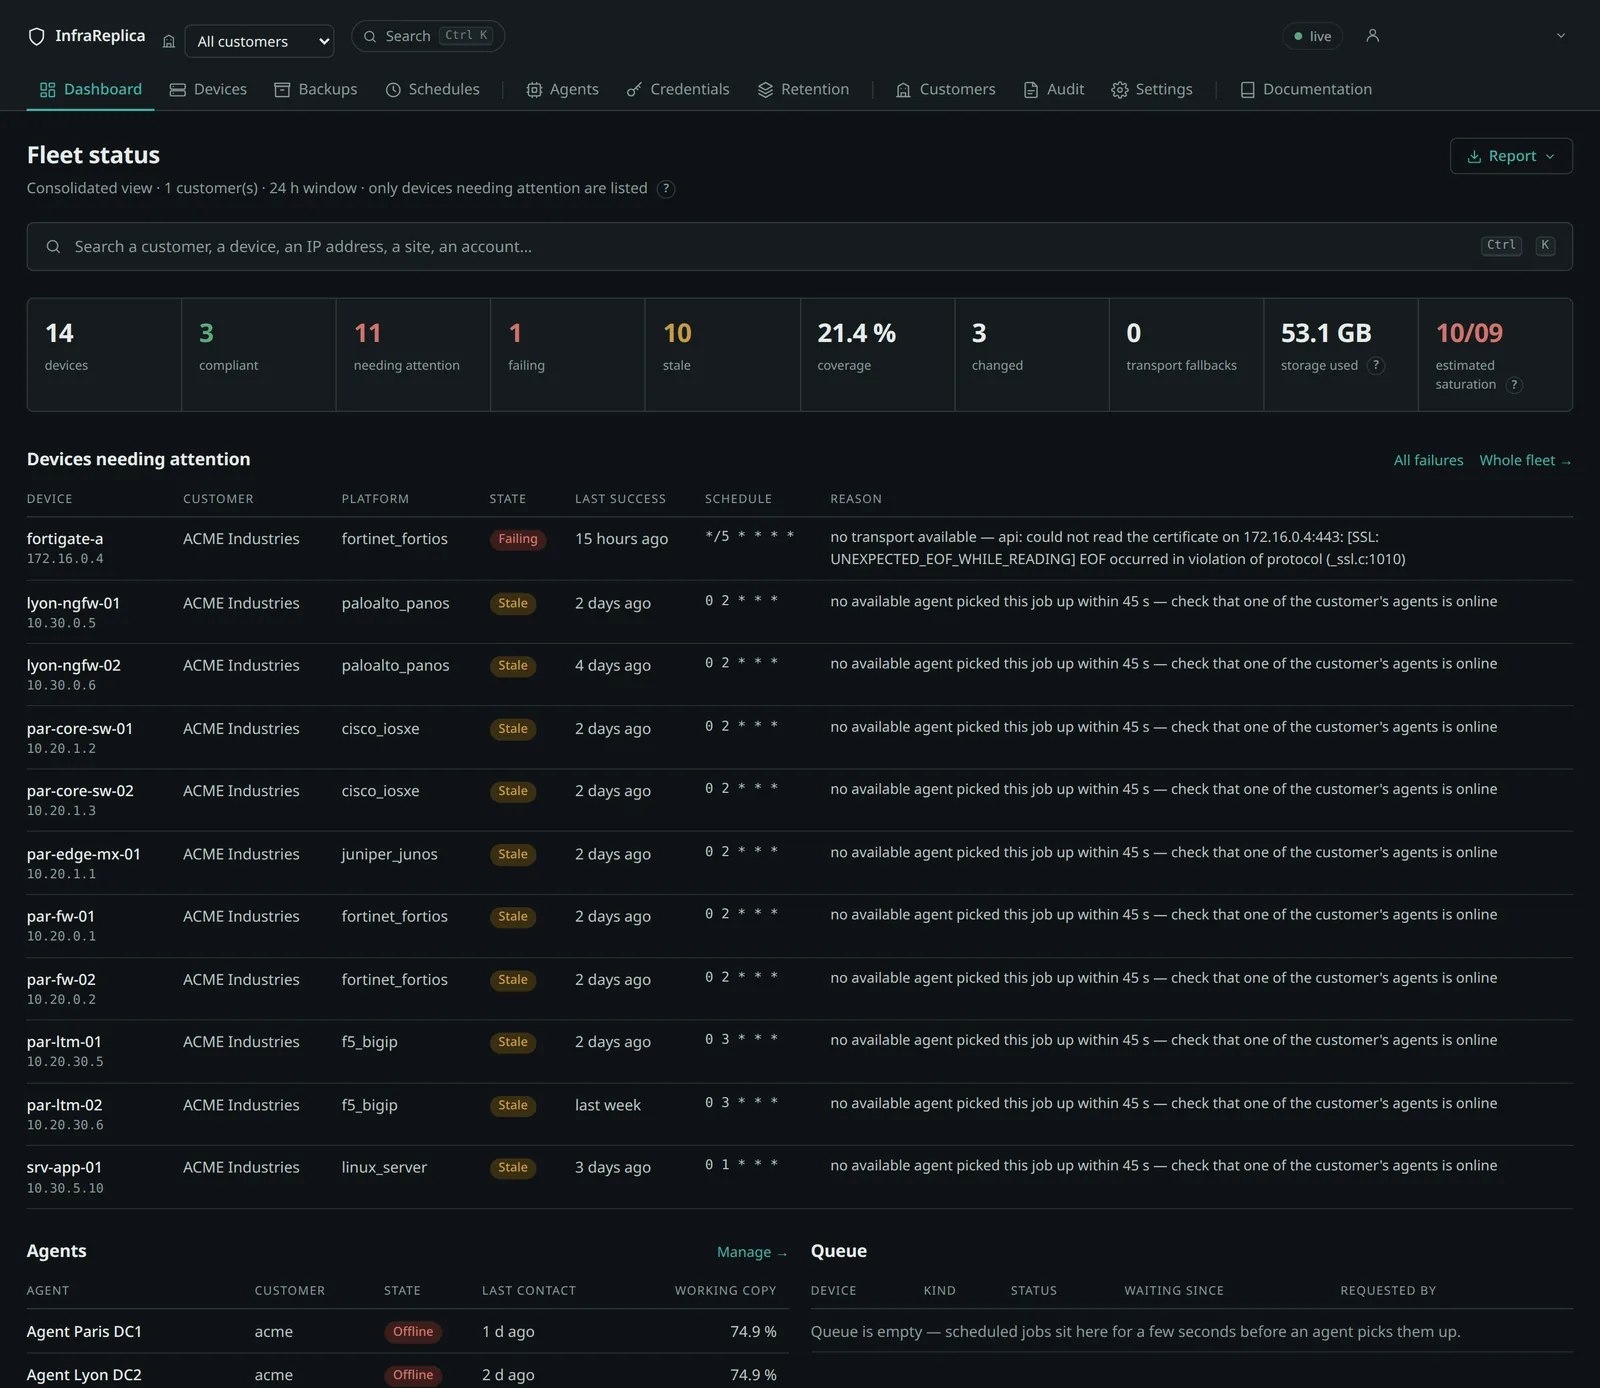
Devices are ranked by decreasing severity: failing, then never backed up and stale, then compliant.
A collection failure is a first-class category. It is never treated as an absence of change, and the age of the last successful backup appears explicitly, device by device. Without that, a device unreachable for three weeks would show as “no change” — the failure mode nobody wants.
Two formats, one single source
| Format | For whom |
|---|---|
| Formatted PDF | the customer, the operator, the monthly review |
| JSON | monitoring, billing, an AI agent, anything that consumes |
Both are produced from the same source. A PDF re-issued six months later says exactly what the one sent to the customer said: it is the JSON kept on file that governs.
backup report --tenant acme                 # exception view, in the terminal
backup report --tenant acme --view all      # complete inventory
backup report --pdf /tmp/consolidated.pdf   # all customers, as PDF
backup report --tenant acme --json          # raw JSON
Also via the API. This is the entry point to wire into monitoring, or to hand to an agent.
# One customer's report, exception view (default)
curl -s "$BASE/api/reports/daily?tenant=$CUSTOMER" -H "Authorization: Bearer $TOKEN"

# Complete inventory
curl -s "$BASE/api/reports/daily?tenant=$CUSTOMER&view=all" -H "Authorization: Bearer $TOKEN"

# Consolidated report, all customers — without the “tenant” parameter
curl -s "$BASE/api/reports/daily" -H "Authorization: Bearer $TOKEN"

# The same, as PDF
curl -s -OJ "$BASE/api/reports/daily?tenant=$CUSTOMER&format=pdf" \
  -H "Authorization: Bearer $TOKEN"
Structure of the JSON
The fields useful to whoever consumes the report:
| Field | Content |
|---|---|
day |
report date |
kind |
tenant or consolidated |
summary |
counters: devices, ok, exceptions, failing, stale, coverage_pct, changed, transport_fallbacks |
exceptions |
the devices calling for action, ranked by severity |
by_tenant |
one section per customer; contains devices in all view |
agents |
each agent's state, including lab_mode and staging_used_pct |
Each device row carries in particular state (ok, never, stale,
failing), last_success_at, last_success_age_label, last_error,
transport_used, transport_fell_back, schedule and next_run_label.
lab_mode deserves particular attention: an agent in
lab mode produces backups that correspond to no real
device. Monitoring that consumes this report must treat that flag as an alarm,
not as a detail.
Freezing a report
A report can be kept as it stood on a given day:
curl -s -X POST "$BASE/api/reports/daily/persist?tenant=$CUSTOMER" \
  -H "Authorization: Bearer $TOKEN"

# The reports kept on file
curl -s "$BASE/api/reports?tenant=$CUSTOMER&limit=30" -H "Authorization: Bearer $TOKEN"
That is what makes it possible to re-issue, six months later, exactly the document sent to the customer — and not a recomputation over data that has changed since.
What coverage measures
coverage_pct is the share of devices in the compliant state across the
whole perimeter. A fleet at 100% is one where every device has a successful
backup within its staleness tolerance — not one where everything was backed up
today.
Audit log
The log covers views, not only modifications. It is the counterpart to the provider's staff having global access to every customer's data.
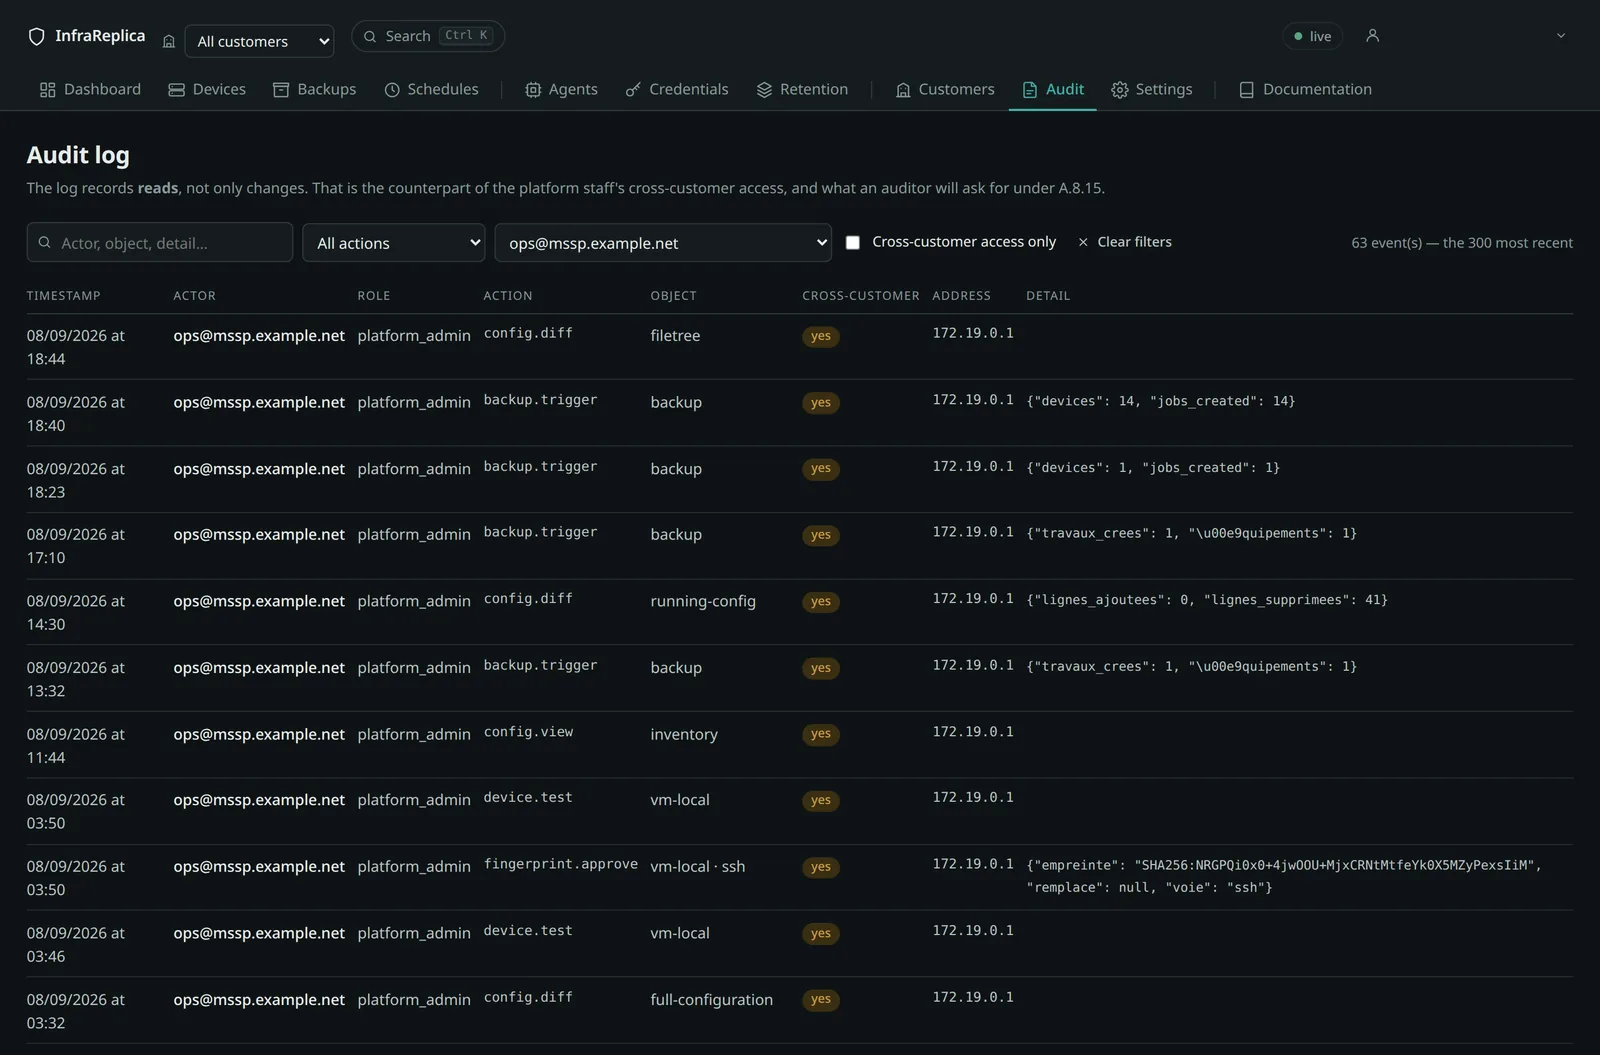
The cross-customer filter is the access-review view: who, among the provider's staff, read which customer's data, and when.
Also via the API.
Requires# The last 200 events curl -s "$BASE/api/audit?tenant=$CUSTOMER" -H "Authorization: Bearer $TOKEN" # Only staff access to a customer's data curl -s "$BASE/api/audit?cross_tenant_only=true&limit=1000" \ -H "Authorization: Bearer $TOKEN" # Filter on a kind of action curl -s "$BASE/api/audit?action=config.download&limit=500" \ -H "Authorization: Bearer $TOKEN"audit:read. Every event carries the timestamp, the actor, their role, the action, the object, the customer concerned, the address and a structured detail.
The log is append-only: the application role holds neither the update right nor the delete right on that table, which makes the guarantee verifiable by an auditor rather than promised by the code.
Storage compliance
Settings → Storage compliance genuinely queries the object store and reports the state of versioning, of locking and of the service accounts, customer by customer. An auditor asks for the proof, not the intention.
Also via the API.
Answers503if the storage is unreachable — an absence of answer is information, not a success.